Plotting
| Plotting | |
| Functions | |
| Plot2D | Plots a system of 2 variables |
| PlotCurve3D | Plots a curve given by implicit equations in 3 variables. |
| Plot3D | Plots a system of 3 variables using maple internal plotting functions. |
| Plot3Dglsurf | Plots a system of 3 variables using glsurf. |
| Plot3Dsurfex | Plots a system of 3 variables using surfex (software based on surf). |
| PlotWorkspace | Plot the border of a manipulator workspace |
| Configurations | Computes the different possible positions. |
| PlotRobot2D | Plot a planar manipulator |
| PlotRobot3D | Plot a 3D manipulator |
| PlotCell3D | Plot the cells returned CellDecomposition or CellDecompositionPlus |
| PlotCell2D | Plot the cells returned CellDecomposition or CellDecompositionPlus |
| SetCellColors | Set colors to the numbers of solutions obtained by NumberOfSolutionsPlus |
| Path | Interpolate points linearly. |
| Trajectory | Display a given trajectory. |
| ImageTrajectory | Display a given trajectory. |
Plot2D
Plot2D := proc ( sys ::{algebraic, equation(algebraic), list({algebraic,equation(algebraic), algebraic<algebraic}), list(list({algebraic,equation(algebraic), algebraic<algebraic}))}, e1 ::name = range, e2 ::name = range, { points ::truefalse := false, [ notest, draft ] ::truefalse := false } )
Plots a system of 2 variables
Parameters
| sys | a list or a list of list of polynomials: the system |
| v1 = r1 | v1 is a name of sys and r1 a range of values |
| v2 = r2 | v2 is a name of sys and r2 a range of values |
| points = bool (optional) | bool is a boolean: if false, isolated points are ignored; default value: false; |
| notest = b (optional) | b is a boolean; when b is true the inequality and real constraints are ignored; default value: true; |
| opts (optional) | arguments passed to the maple function plots:-implicitplot |
Returns
A graphic: the solutions of the system.
- when sys is a polynomial, the graphic is the zeroes of this polynomial
- when sys is a list of polynomials [p1,...,pk], the graphic is the zeroes of the system p1=0 and ... and pk=0
- when sys is a list of list of polynomials [L1,...,Lk], the graphic is the union of the zeroes of each system L1, ..., Lk.
PlotCurve3D
PlotCurve3D := proc ( sys ::{algebraic, equation(algebraic), list({algebraic,equation(algebraic), algebraic<algebraic}), list(list({algebraic,equation(algebraic), algebraic<algebraic}))}, ineq ::list({polynom, polynom<polynom}) := [], e1 ::name = range := sort ([op(indets([sys,x,y,z],name))])[1] =-5..5, e2 ::name = range := sort ([op(indets([sys,x,y,z],name) minus {lhs(e1)})])[1] =-5..5, e3 ::name = range := sort ([op(indets([sys,x,y,z],name) minus {lhs(e1),lhs(e2)})])[1] =-5..5, { grid ::integer := 30, output ::identical(list,display) := ':-display' } )
Plots a curve given by implicit equations in 3 variables.
Parameters
| sys | a list or a list of list of polynomials: the system |
| v1 = r1 | v1 is a name of sys and r1 a range of values |
| v2 = r2 | v2 is a name of sys and r2 a range of values |
| v3 = r3 | v3 is a name of sys and r3 a range of values |
| grid = i (optional) | i is an integer, the number of samples points; default value: 20. |
| output = keyword (optional) | keyword is either list or display: display (resp. list) returns a graph (resp. a list). |
Returns
A graphic: the solutions of the system.
- when sys is a list of polynomials [p1,...,pk], the graphic is the zeroes of the system p1=0 and ... and pk=0
- when sys is a list of list of polynomials [L1,...,Lk], the graphic is the union of the zeroes of each system L1, ..., Lk.
Example
> PlotCurve3D ([x^2+y^2-1, z^2-x],grid=100,title="cusp");
Plot3D
Plot3D := proc ( sys ::{algebraic, equation(algebraic), list({algebraic,equation(algebraic), algebraic<algebraic}), list(list({algebraic,equation(algebraic), algebraic<algebraic}))}, ineq ::list({polynom, polynom<polynom}) := [], e1 ::name = range := sort ([op(indets([sys,x,y,z],name))])[1] =-5..5, e2 ::name = range := sort ([op(indets([sys,x,y,z],name) minus {lhs(e1)})])[1] =-5..5, e3 ::name = range := sort ([op(indets([sys,x,y,z],name) minus {lhs(e1),lhs(e2)})])[1] =-5..5, { points ::truefalse := false, crossingrefine ::truefalse := false, grid ::integer := 10, border ::constant := 10^(-30), output ::identical(list,display) := ':-display', noverbose ::truefalse := false, verboserate ::integer := -10 } )
Plots a system of 3 variables using maple internal plotting functions.
Parameters
| sys | a list or a list of list of polynomials: the system |
| v1 = r1 | v1 is a name of sys and r1 a range of values |
| v2 = r2 | v2 is a name of sys and r2 a range of values |
| v3 = r3 | v3 is a name of sys and r3 a range of values |
| points = bool (optional) | bool is a boolean: if false, isolated points are ignored; default value: false; |
| grid = i (optional) | i is an integer leading to a grid size i x i; default value: 20. |
| border = e (optional) | e is a numeric value: defines the precision on the border; default value: 0.0001. |
| crossingrefine = bool (optional) | bool is a boolean: if true, the mesh follows the cross of the different surfaces; default value: false. |
| output = keyword (optional) | keyword is either list or display: display (resp. list) returns a graph (resp. a list). |
| noverbose = b (optional) | b is a boolean: if true, no verbose is displayed; default value: false |
| verboserate = i (optional) | i is an integer: if positive (resp. negative) the number (resp. the pourcentage) of cells computed before displaying a new verbose line; default value: -10 |
Returns
A graphic: the solutions of the system.
- when sys is a polynomial, the graphic is the zeroes of this polynomial
- when sys is a list of polynomials [p1,...,pk], the graphic is the zeroes of the system p1=0 and ... and pk=0
- when sys is a list of list of polynomials [L1,...,Lk], the graphic is the union of the zeroes of each system L1, ..., Lk.
Plot3Dglsurf
Plot3Dglsurf := proc ( sys ::{algebraic, equation(algebraic), list({algebraic,equation(algebraic)}), list(list({algebraic,equation(algebraic)}))}, e1 ::name = range, e2 ::name = range, e3 ::name = range, { points ::truefalse := false, scale ::identical(constrained, unconstrained) := 'unconstrained' } )
Plots a system of 3 variables using glsurf.
Parameters
| sys | a list or a list of list of polynomials: the system |
| v1 = r1 | v1 is a name of sys and r1 a range of values |
| v2 = r2 | v2 is a name of sys and r2 a range of values |
| v3 = r3 | v3 is a name of sys and r3 a range of values |
| points = bool (optional) | bool is a boolean: if false, isolated points are ignored; default value: false; |
| scaled = keyword (optional) | keyword is one of ‘constrained’ or ‘unconstrained’ for the scaling; default value: scaled = unconstrained. |
Returns
A graphic: the solutions of the system.
- when sys is a polynomial, the graphic is the zeroes of this polynomial
- when sys is a list of polynomials [p1,...,pk], the graphic is the zeroes of the system p1=0 and ... and pk=0
- when sys is a list of list of polynomials [L1,...,Lk], the graphic is the union of the zeroes of each system L1, ..., Lk.
Plot3Dsurfex
Plot3Dsurfex := proc ( sys ::{algebraic, equation(algebraic), list({algebraic, equation(algebraic), algebraic<algebraic}), list(list({algebraic,equation(algebraic)}))}, ineq ::list({polynom, polynom<polynom}) := [], e1 ::name = range := sort ([op(indets([sys,x,y,z]))])[1] =-1..1, e2 ::name = range := sort ([op(indets([sys,x,y,z]))])[2] =-1..1, e3 ::name = range := sort ([op(indets([sys,x,y,z]))])[3] =-1..1, { points ::truefalse := false, scale ::identical(constrained, unconstrained) := 'unconstrained' } )
Plots a system of 3 variables using surfex (software based on surf).
Parameters
| sys | a list or a list of list of polynomials and/or inequalities: the system |
| ineq (optional) | list of polynomials: extra positive inequalities; default value: [] |
| v1 = r1 (optional) | v1 is a name of sys and r1 a range of values; default value: v1=-1..1 where v1 is a variable of sys |
| v2 = r2 (optional) | v2 is a name of sys and r2 a range of values default value: v2=-1..1 where v2 is a variable of sys |
| v3 = r3 (optional) | v3 is a name of sys and r3 a range of values default value: v3=-1..1 where v3 is a variable of sys |
| points = bool (optional) | bool is a boolean: if false, isolated points are ignored; default value: false; |
| scaled = keyword (optional) | keyword is one of ‘constrained’ or ‘unconstrained’ for the scaling; default value: scaled = unconstrained. |
Returns
A graphic: the solutions of the system.
- when sys is a polynomial, the graphic is the zeroes of this polynomial
- when sys is a list of polynomials [p1,...,pk], the graphic is the zeroes of the system p1=0 and ... and pk=0
- when sys is a list of list of polynomials [L1,...,Lk], the graphic is the union of the zeroes of each system L1, ..., Lk.
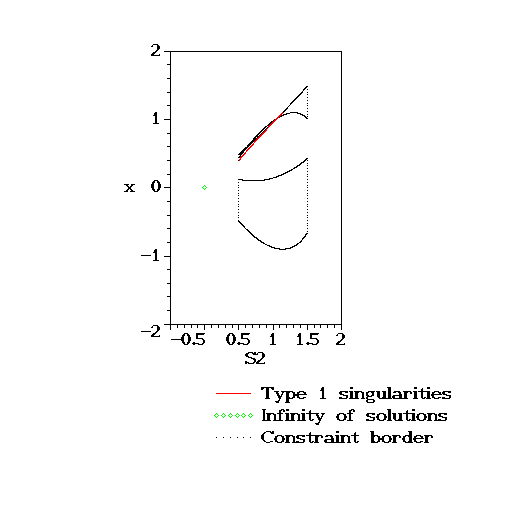
PlotWorkspace
PlotWorkspace := proc ( robot ::Manipulator, spec ::seq(name=constant), disp ::seq(identical(type1,type2, constraints,infinite)) := ('type1','type2','constraints','infinite'), vars ::{list(name), identical(articular, pose)} := 'articular', ranges ::seq(name=range) := NULL, { notest ::truefalse := false } )
Plot the border of a manipulator workspace
Parameters
| robot | a object of type Manipulator |
| spec | sequence of name=constant: the specification of the known variables (the articular values or the pose values, or other) |
| disp (optional) | a sequence of keywords among type1, type2, constraints and infinite: selects the graphics to plot; default value: all the keywords |
| vars (optional) | the display variables, that can be referred as: |
- one of the keyword ‘articular’ or ‘pose’
- a list of 2 variable names
- the default value is ‘articular’
- if ranges is provided, the variables superseed those of vars
| ranges (optional) | a sequence of the form v1=n1..n2, v2=m1..m2 where v1, v2 are 2 variables and n1,n2,m1,m2 are numerical values; when ranges is not specified, the default range is taken from the field robot:-DefaultPlotRange if it exists, and is -5..5 otherwise. |
| notest = b (optional) | b is a boolean; when b is true the inequality and real constraints are ignored; default value: true; |
Returns
A graphic containing:
- The singularities of type 1
- The singularities of type 2
- The configurations with infinitely many solutions in all tha variables (including the passive variables)
- The border induced by the constraints
Example
> rprrp := Parallel_RPRRP ():
> PlotWorkspace (rprrp, articular);
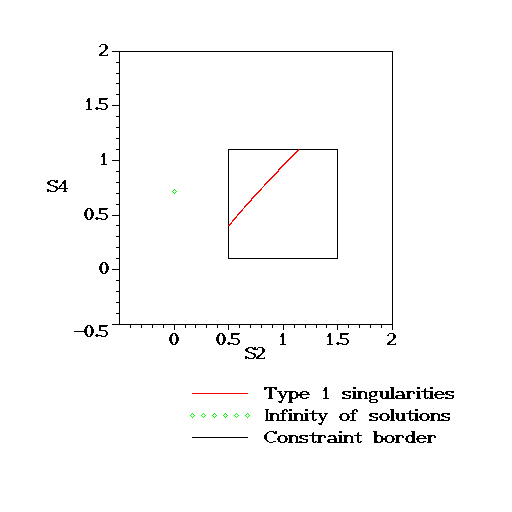
> PlotWorkspace (rprrp, pose);
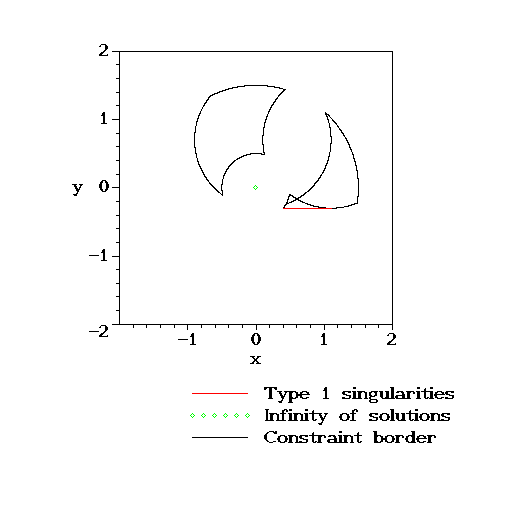
> PlotWorkspace (rprrp, [S2,x]);
Configurations
Configurations := proc ( robot ::Manipulator, spec ::seq(name=constant), { noconstraints ::truefalse := false, ordering ::name := NULL } )
Computes the different possible positions.
Parameters
| robot | an object of type Manipulator |
| spec | sequence of name=constant: the specification of the known variables (the articular values or the pose values, or other) |
| noconstraints=*b* (optional) | b is a boolean: when true, the constraint inequalities are ignored; default value: false. |
| ordering (optional) | ordering is a name used to order the solutions; default value: NULL |
Returns
A list of elements: each elements is a list of name=list(constant) and represents a configuration of the input manipulator.
Example
> rpr := Parallel_3RPR ():
> Configurations (rpr, r1=20, r2=20, r3=20);
[[A1 = [0., 0.], A2 = [15.91, 0.], A3 = [0., 10.00],

    B1 = [1.238874219, -19.96159289], B2 = [18.27856689, -19.85925202],

    B3 = [14.37838350, -3.78571901]], [A1 = [0., 0.], A2 = [15.91, 0.],

    A3 = [0., 10.00], B1 = [-15.37568723, 12.79016193],

    B2 = [1.62170358, 13.99444837], B3 = [-3.30997940, 29.78205101]], [

    A1 = [0., 0.], A2 = [15.91, 0.], A3 = [0., 10.00],

    B1 = [19.99999727, -0.01045036340], B2 = [31.39060352, 12.66297417],

    B3 = [16.87622894, 20.59410427]], [A1 = [0., 0.], A2 = [15.91, 0.],

    A3 = [0., 10.00], B1 = [-13.64842837, -14.61917929],

    B2 = [-4.083315519, -0.51704413], B3 = [-19.53983068, 5.37074264]]]
PlotRobot2D
PlotRobot2D := proc ( robot ::Manipulator, spec ::seq(name=constant), k ::{integer,range,list(integer)} := .., { color := [], legendvars := subs (map(s->lhs(s)=NULL,[spec]), [op(robot:-ArticularVariables), op(robot:-PoseVariables), op(robot:-PassiveVariables), 'det(J)']), nolegend ::truefalse := false, noconstraints ::truefalse := false } )
Plot a planar manipulator
Parameters
| robot | a Manipulator: the robot to plot |
| spec | a sequence of name=constant: specification of variables of the robot to plot |
| k (optional) | an integer: specifies one of the possible configuration when several are available |
| color=col (optional) | equation of the shape color=*col*, where col is a color or a list of colors; when the number of specified color is not enough, deterministic colors are chosen; default value: empty list. |
| legendvars (optional) | list of names: the variables to display in the legend; default value: the articular, passive and pose variables, minus the variables in spec |
| nolegend=b (optional) | b is a boolean: when false, a legend is displayed (the graphic appears in a separate windows with a classic worksheet); default value: false. |
Returns
A graphic: the different configurations of the manipulator satisfying the input specifications. (Maple 13 and higher only)
Example
> rpr := Parallel_3RPR ():
> PlotRobot2D (rpr, r1=20, r2=20, r3=20);
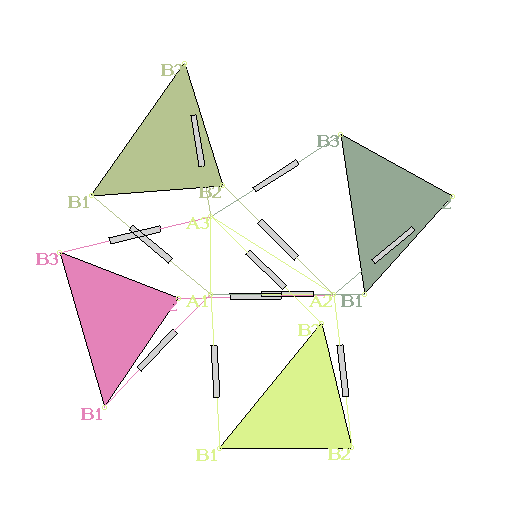
> rr := Parallel_2RR():
> plots:-animate (PlotRobot2D, [rr, theta1=1+t, theta3=2-t], t=0..1);
PlotRobot3D
PlotRobot3D := proc ( robot ::Manipulator, spec ::seq(name=constant), k ::{integer,range,list(integer)} := .., { color := [], legendvars := subs (map(s->lhs(s)=NULL,[spec]), [op(robot:-ArticularVariables), op(robot:-PoseVariables), op(robot:-PassiveVariables), 'det(J)']), nolegend ::truefalse := false, noconstraints ::truefalse := false, nolabel ::truefalse := false } )
Plot a 3D manipulator
Parameters
| robot | a Manipulator: the 3D robot to plot |
| spec | a sequence of name=constant: specification of variables of the robot to plot |
| k (optional) | an integer: specifies one of the possible configuration when several are available |
| color=col (optional) | equation of the shape color=*col*, where col is a color or a list of colors; when the number of specified color is not enough, deterministic colors are chosen; default value: empty list. |
| legendvars=l (optional) | l is list of names: the variables to display in the legend; default value: the articular, passive and pose variables, minus the variables in spec |
| nolegend=b (optional) | b is a boolean: when false, a legend is displayed (the graphic appears in a separate windows with a classic worksheet); default value: false. |
| nolabel=b (optional) | b is a boolean: when true, no label appears on the articulations; default value: false. |
Returns
A graphic: the different configurations of the manipulator satisfying the input specifications. (Maple 13 and higher only)
Example
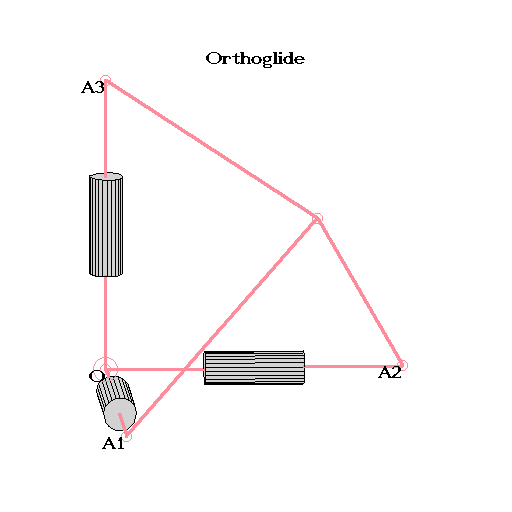
> robot := Orthoglide():
> PlotRobot3D (robot, r1=1,r2=1,r3=1, 2);
PlotCell3D
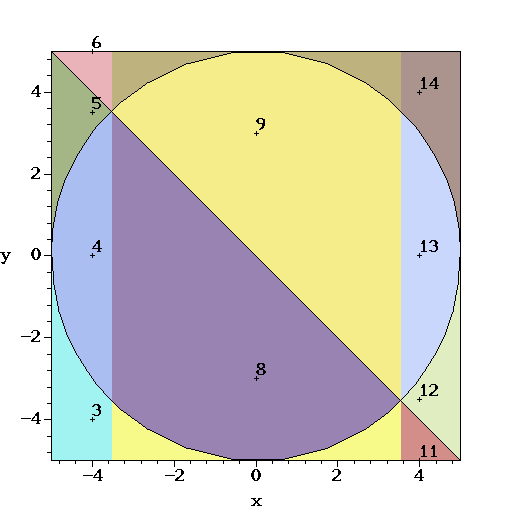
PlotCell3D := proc ( cells ::record, i ::{list(integer),integer} := [ $ 1 .. nops(cells:-SamplePoints) ], ranges ::seq(name=range) := NULL, { nowall ::truefalse := false, grid ::integer := 10, border ::constant := 0.0000001, color := [], noverbose ::truefalse := false, verboserate ::integer := -10 } )
Plot the cells returned CellDecomposition or CellDecompositionPlus
Parameters
| cells | an object returned by CellDecomposition or CellDecompositionPlus |
| i (optional) | an integer or a list of integer: the indices of the cells to plot in cells. default value: all the cells |
| ranges (optional) | a sequence of the form v=n1..n2 where v is a variable and n1,n2 are numerical values; when not specified for a variable, the default range is -5..5. |
| grid = i (optional) | i is an integer leading to a grid size i x i; default value: 10. |
| border = e (optional) | e is a numeric value: defines the precision on the border; default value: 0.0000001. |
| nowall = b (optional) | b is a boolean; when b is true the vertical faces are not displayed |
| color = col (optional) | equation of the shape color=*col*, where col is a color or a list of colors; when the number of specified color is not enough, deterministic colors are chosen; default value: empty list. |
| noverbose = b (optional) | b is a boolean: if true, no verbose is displayed; default value: false |
| verboserate = i (optional) | i is an integer: if positive (resp. negative) the number (resp. the pourcentage) of cells computed before displaying a new verbose line; default value: -10 Returns: A 3D plot of the cells indiced by i in cells. |
Example
> cells := CellDecompositionPlus ([T],[25-(x^2+y^2+z^2),x+y],[T],[x,y,z]):
> PlotCell3D (cells,[11,15],color=blue);
PlotCell2D
PlotCell2D := proc ( cells ::record, i ::{list(list(integer)),list(integer),integer} := [ $ 1 .. nops(cells:-SamplePoints) ], ranges ::seq(name=range) := NULL, { samplepoints ::truefalse := false, nowall ::truefalse := false, grid ::integer := 10, border ::constant := 0.0000001, color := [], downupcolors ::list := [], points ::list := [], colorpoints ::list := [], noverbose ::truefalse := false, verboserate ::integer := -10 } )
Plot the cells returned CellDecomposition or CellDecompositionPlus
Parameters
| cells | an object returned by CellDecomposition or CellDecompositionPlus |
| i (optional) | an integer, a list of integer or a list of list of integer: the indices of the cells to plot in cells. default value: all the cells |
| ranges (optional) | a sequence of the form v=n1..n2 where v is a variable and n1,n2 are numerical values; when not specified for a variable, the default range is -5..5. |
| grid = i (optional) | i is an integer leading to a grid size i x i; default value: 10. |
| border = e (optional) | e is a numeric value: defines the precision on the border; default value: 0.0000001. |
| nowall = b (optional) | b is a boolean: when b is true the vertical faces are not displayed; default value: false. |
| color = col (optional) | equation of the shape color=*col*, where col is a color or a list of colors; when the number of specified color is not enough, deterministic different colors are chosen; default value: empty list. |
| samplepoints = b (optional) | b is a boolean; if true, the labels of the cells are displayed; default value: false. |
| downupcolors = ducol (optional) | list stating the colors of the lower and upper borders of each cell in the follwing form: [[downcol_cell1, upcol_cell1], [downcol_cell2, upcol_cell2],...] default value: empty list. |
| points = pts (optional) | list of coordinates of points to be plot of the form [[x1,y1], [x2,y2], ...] default value: empty list. |
| colorpoints = colpts (optional) | list of colors for the points specified in “points=pts” of the form [col_pt1, col_pt2, ...] default value: empty list. |
| noverbose = b (optional) | b is a boolean: if true, no verbose is displayed; default value: false |
| verboserate = i (optional) | i is an integer: if positive (resp. negative) the number (resp. the pourcentage) of cells computed before displaying a new verbose line; default value: -10 |
Returns
A 2D plot of the cells indiced by i in cells.
Example
> cells := CellDecompositionPlus ([T],[25-(x^2+y^2),x+y],[T],[x,y]):
> PlotCell2D (cells,samplepoints);
SetCellColors
SetCellColors := proc ( Lc, Lp )
Set colors to the numbers of solutions obtained by NumberOfSolutionsPlus
Parameters
| Lc | list returned by NumberOfSolutionsPlus |
| Lp | list returned by DVNumberOfSolutionsPlus |
Returns
a list of lists C ready to be used by PlotCell2D: C[1] - contains the numbers of the cells to be plotted C[2] - contains the inner colors for the cells C[3] - contains the colors for the lower and upper borders of the cells C[4] - contains the coordinates of the points to be plotted C[5] - contains the colors for the points to be plotted.
Trajectory
Trajectory := proc ( L ::list, steps ::integer := 20, { color := [] } )
Display a given trajectory.
Parameters
| L | list or list of list of points in the plane or 3d space. |
| steps | integer: the number of interpolated points. |
| color (optional) | a color name or a list of color names; default value: []. |
Returns
A plot of the given trajectory:
- if the input is a list of list of points, then the i-th list is a path colorized with the i-th element of color (or with color directly if it is a color name). If there is no i-th color, a random color is chosen.
- if the input is a list of points, then a list of list of points is created by computing steps points between 2 consecutive points. Then this list of list is displayed.
Example
> Trajectory ( [[0,0],[1,1],[-1,1]],     # the list of vertices
               color=[blue,red] );       # colors of the edges
ImageTrajectory
ImageTrajectory := proc ( robot ::Manipulator, L ::list, pars ::list(name) := robot:-ArticularVariables, vars ::list(name) := robot:-PoseVariables, steps ::integer := 20, { color := [], loop ::truefalse := false } )
Display a given trajectory.
Parameters
| robot | the manipulator under study |
| L | list or list of list of points; a point is a list of numerical values, coordinates of the variables pars; |
| pars | list of name; default value: robot[ArticularVariables]. |
| vars | list of name: the image space, a list of 2 or 3 variables; default value: robot[PoseVariables]. |
| steps | integer: the number of interpolated points. |
| color (optional) | a color name or a list of color names; default value: []. |
| loop (optional) | a boolean: if true and L is a list of vertices, then the last point is connected to the first one. |
Returns
A plot of the given trajectory:
- if the input is a list of list of points, then the i-th list is a path colorized with the i-th element of color (or with color directly if it is a color name). If there is no i-th color, a random color is chosen.
- if the input is a list of points, then a list of list of points is created by computing steps points between 2 consecutive points. Then this list of list is displayed.
Example
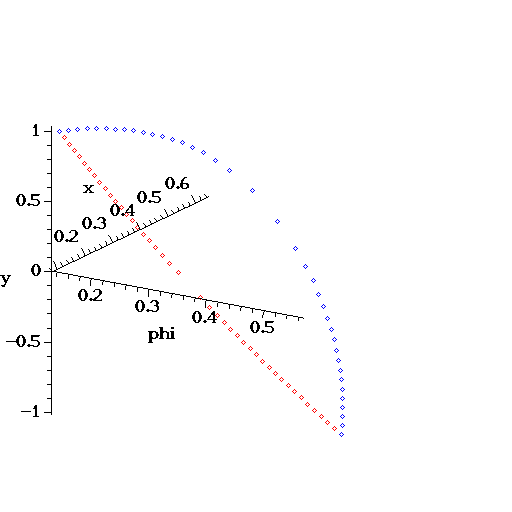
> robot := ParallelRPR2PRR();
> ImageTrajectory (robot,                       # the manipulator
                   [[0,0,0],[1,1,1],[-1,1,1]],  # the list of vertices
                   [S1,alpha2,alpha3],          # the input variables
                   [phi,x, y],                  # the output variables
                   50,                          # number of inbetween points
                   color=[blue,red],            # colors of the edges
                   symbol=soliddiamond);        # additional plot options